
Your story is coming together and the data is there, but now comes the part of writing a paper that most researchers have never been formally taught: creating figures. In this blog post I will introduce three concepts which are essential for setting up figures; vector versus raster software programs, image resolution, and color modes.
Vector versus Raster
Pro tip: Pick a vector-based software program to create your figure.
The first problem to contend with in creating beautiful research figures is which software to use. You have the options of vector or raster programs. Raster programs build images by putting together groups of pixels (‘picture element’), which are just tiny blocks of color. The problem with creating your figures in a raster program like Adobe Photoshop is that your figure will not be infinitely scalable. When you enlarge the image, the blocks of color just increase in size, leading to a fuzzy or even blocky image.
The other problem with using a raster-based program for figure design is time. If you try to compensate for pixel size by setting your resolution super high, you’ll likely pay for it in computational time, even for small tasks. Raster programs are not fast, especially with large file sizes.
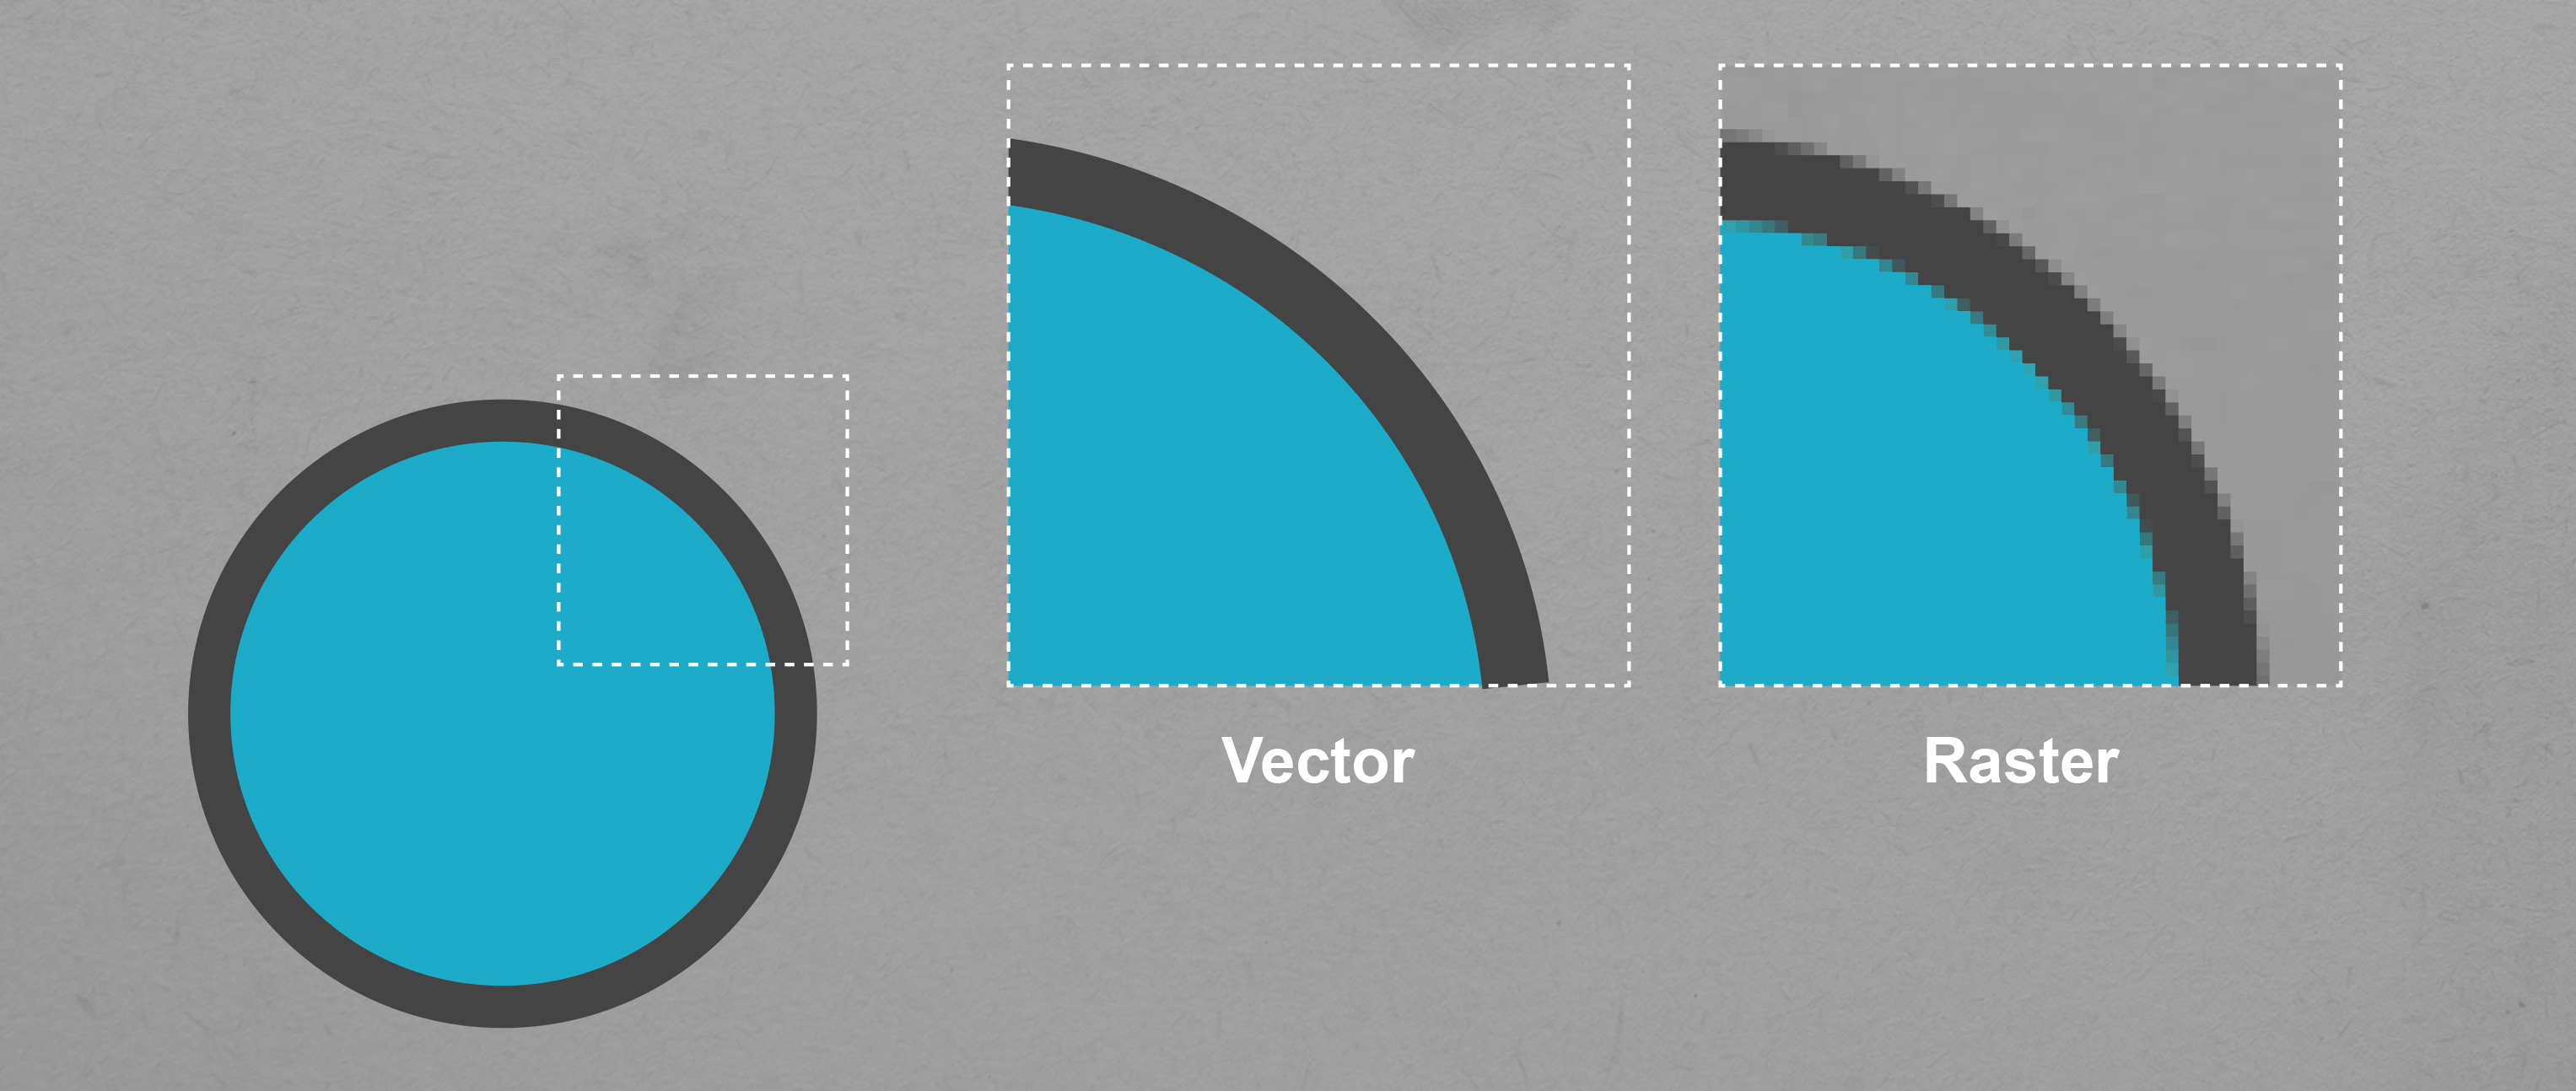
If you create a circle in a vector-based program like Adobe Illustrator and enlarge it, you can do so infinitely without a reduction in quality. However, if you make the same circle in a raster program and enlarge it, the pixels will increase in size resulting in a blocky or fuzzy image. (Dr. Anne Martin)
Alternatively, vector-based programs use mathematically defined shapes and lines through coordination of connected points called Bezier points. This creates a wireframe that is able to be easily expanded without any loss or blurring of information. In graphic design, most folks are trained to use Adobe Illustrator as a vector-based program — this software will give you great flexibility with your designs. Luckily, several universities now offer the Adobe Creative Suite as part of their free software packages. If you do not have free Creative Suite access, then check out similar free programs such as Inkscape.
Note: One thing to point out is that even though you are using a vector-based program, any images you place into your file will not suddenly become vectorized. Images are raster and cannot be converted. For instance, any immunostain images will have to be at a sufficient size before you place them in the file. This brings us to our second essential publishing concept: resolution.
Resolution
Pro tip: Save original, unmanipulated raw image files at a high resolution – 300 PPI (pixels per inch) or higher.
You may have heard reference to the concept of resolution in the past in terms of “Image resolution should be set to 300 dpi”, but what does that mean? The two terms here to understand are PPI and DPI. PPI, or pixels per inch, defines the number of pixels to fill an inch of space. Decreasing the PPI means that you will have fewer pixels per inch resulting in larger pixels that make your image look blocky. Confused? Let’s look at an example, if you have a 653 x 653 microscopy image and set the PPI to 10, the size of the image will be 65.3 x 65.3 inches because 653 / 10 = 65.3. Since the number of pixels per inch is so low, they will have to be much larger to fill an inch of space. Conversely, if we set the resolution to 300 PPI, the size of the image will be 2.2 x 2.2 inches (653 / 300 = 2.2) and the image will not appear fuzzy because we have 300 pixels filling each inch of space. In other words, PPI adjusts the size of your image and the greater the pixel density of your image, the higher the resolution. Now, try to resample that same image at 2.2 x 2.2 inches at 10 PPI resolution. Now we can see the pixels because we are limited to fewer pixels per inch in a smaller total size.
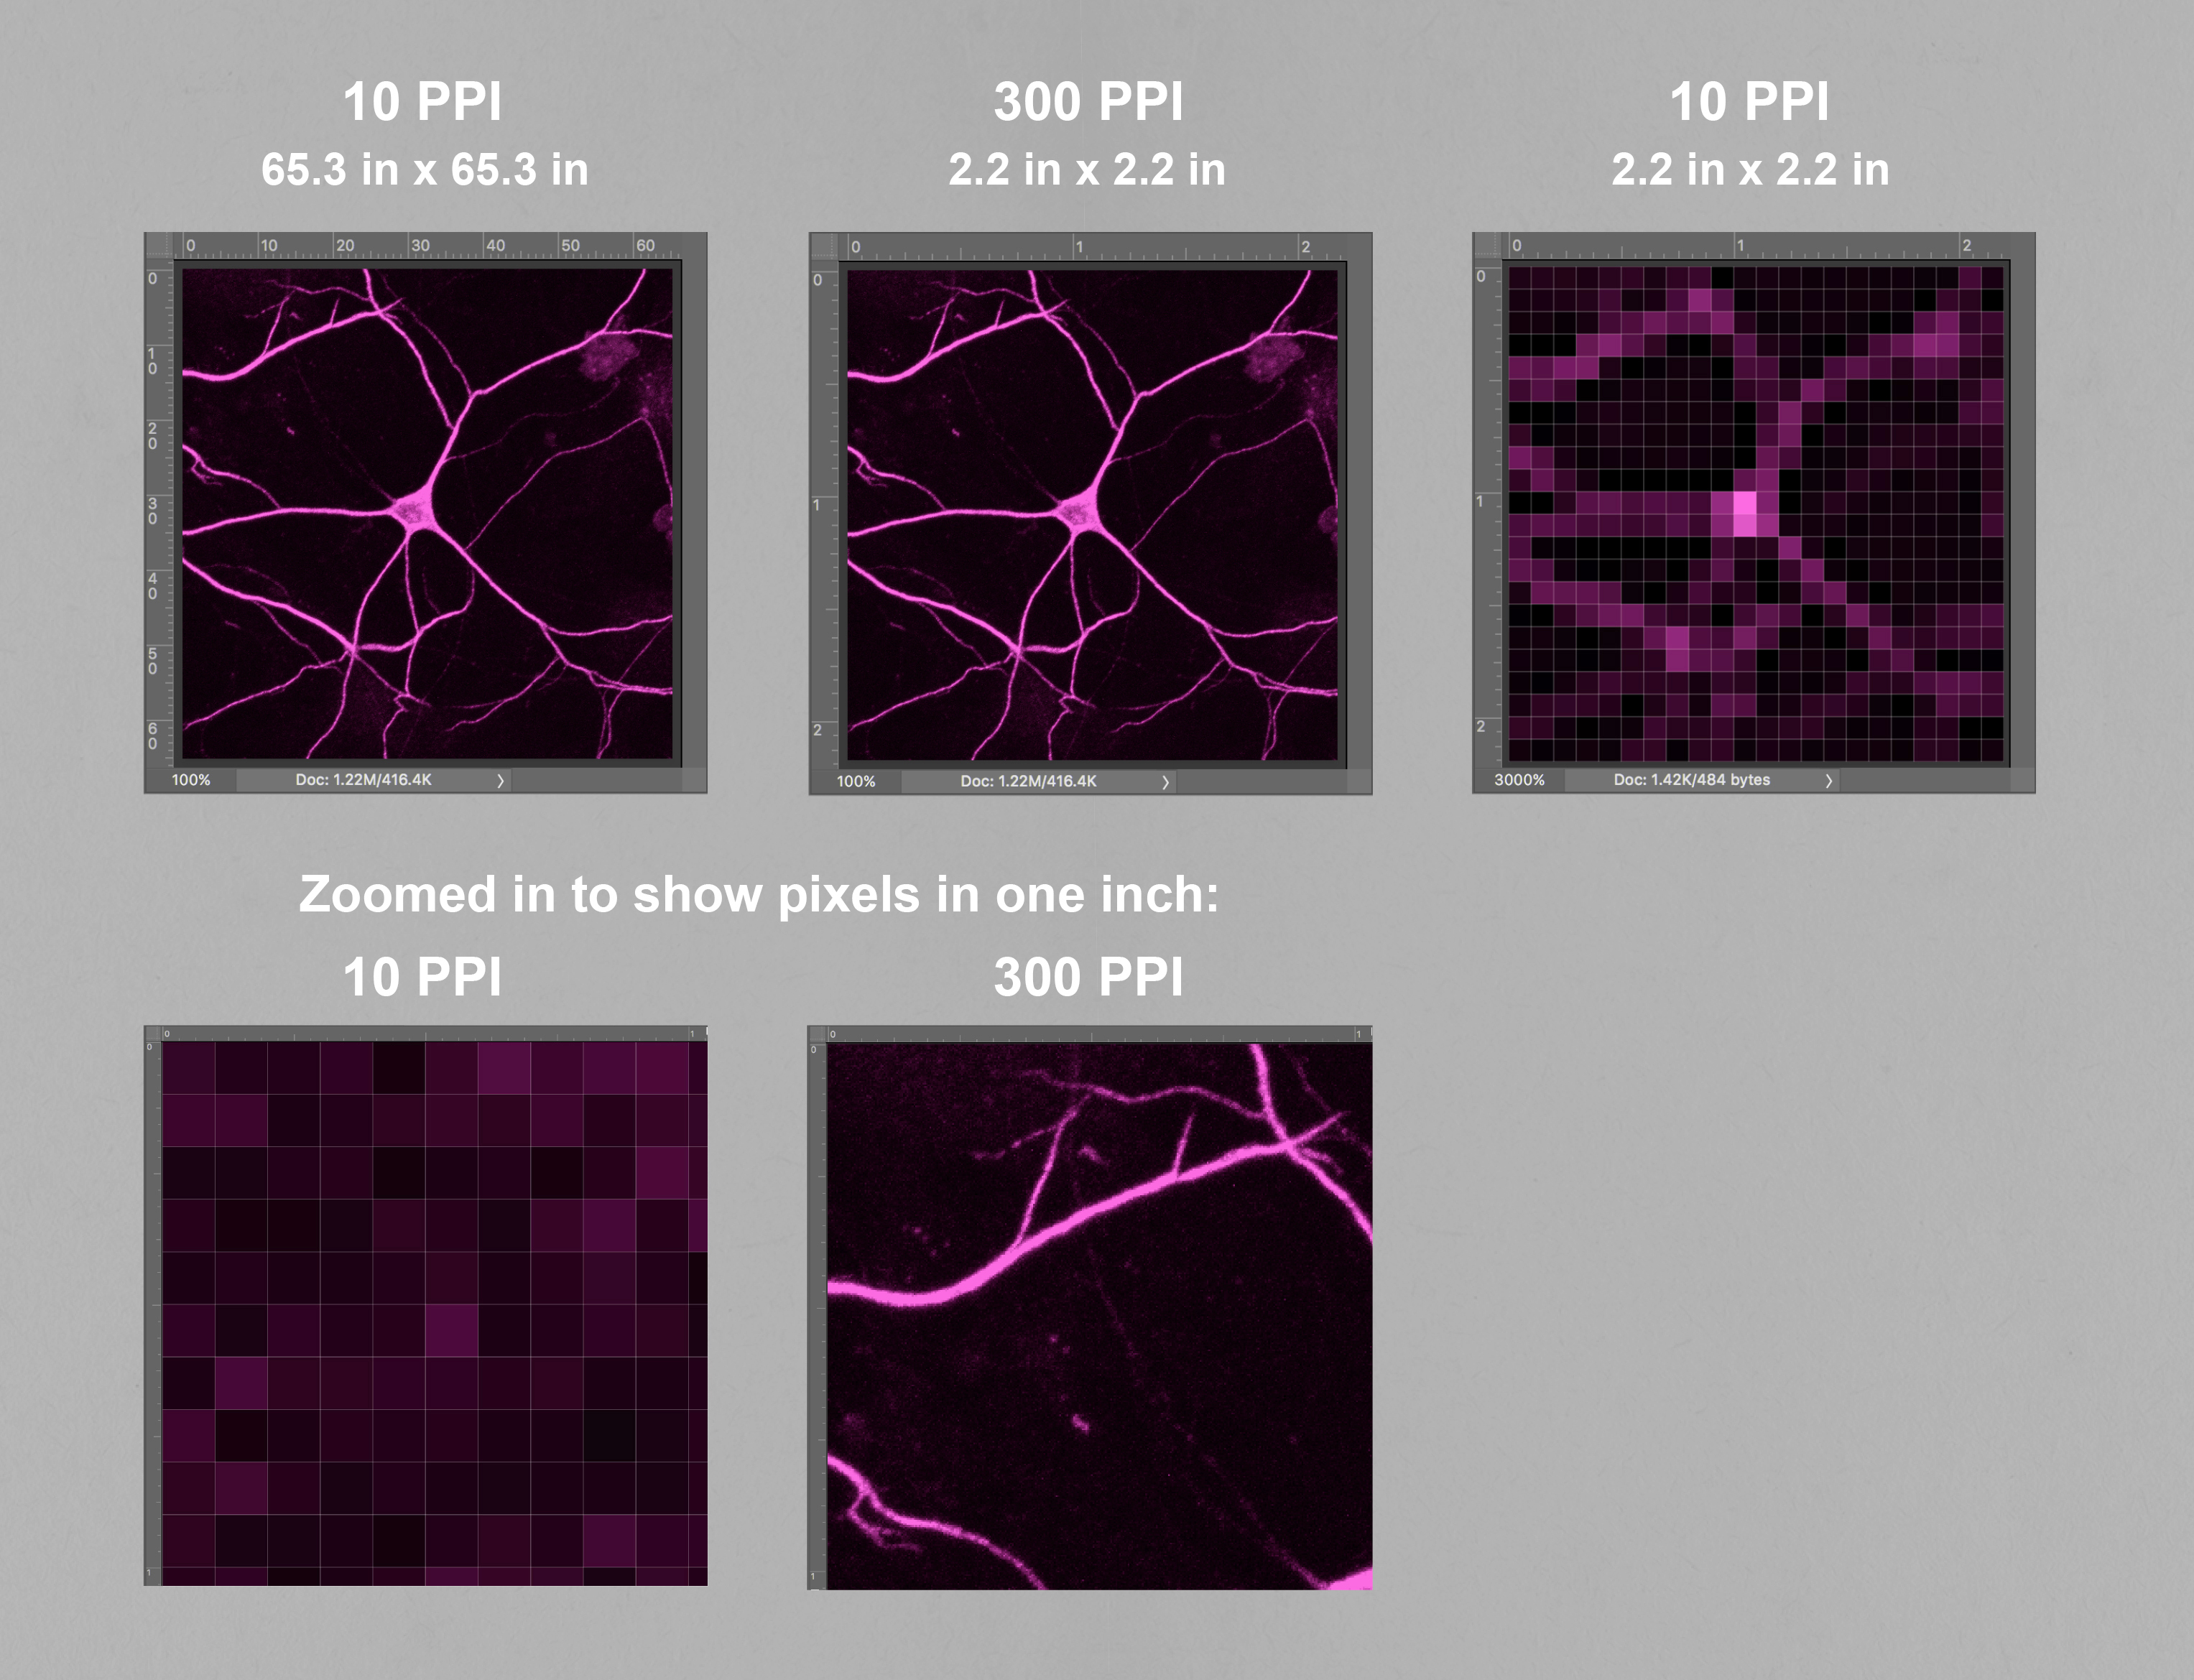
If you set your image to a small PPI the image size will be large but the image quality will be poor. A larger PPI will result in a smaller image at a higher quality. (Dr. Anne Martin)
Now, you are probably more familiar with DPI rather than PPI. The two terms are often confused, but DPI is specifically a printing term and stands for dots per inch. Printers don’t print in solid pixel blocks, but instead print in a series of dots and the resolution of these printouts are described in the density of dots per inch. In general, 300 DPI is the preferred resolution for most publishing, but some journals have different requirements, so be sure to check for it when prepping your work!
In the end, PPI is what you should be paying most attention to, but make sure the DPI is set to your journal’s specifications as well.
Note: When creating images, try to save a copy of them at the highest resolution you reasonably can (you’ll use a lower quality version in your final product, but the raw will be nice to have on hand – while you can always ‘zoom out’, you can only ‘zoom in’ as far as your original – the television show CSI is full of lies). Save this raw image file and then create a second version to use for your paper at desired size and resolution. You want to keep the original file pristine so if you need it at a larger size later you can always come back to it.
RGB versus CMYK
Pro tip: Keep your original files in RGB and only convert to CMYK if the journal you are submitting to requires it.
RGB and CMYK are both color modes and you’ll be asked to choose one when you first create a file in Illustrator. RGB is short for Red, Green, Blue and is typically used in computer monitors and other displays. It works additively, or in other words, it creates different colors by adding varying quantities of red, green, and blue (add all three and you get white). This is widely used because of the wide range of colors you can achieve.
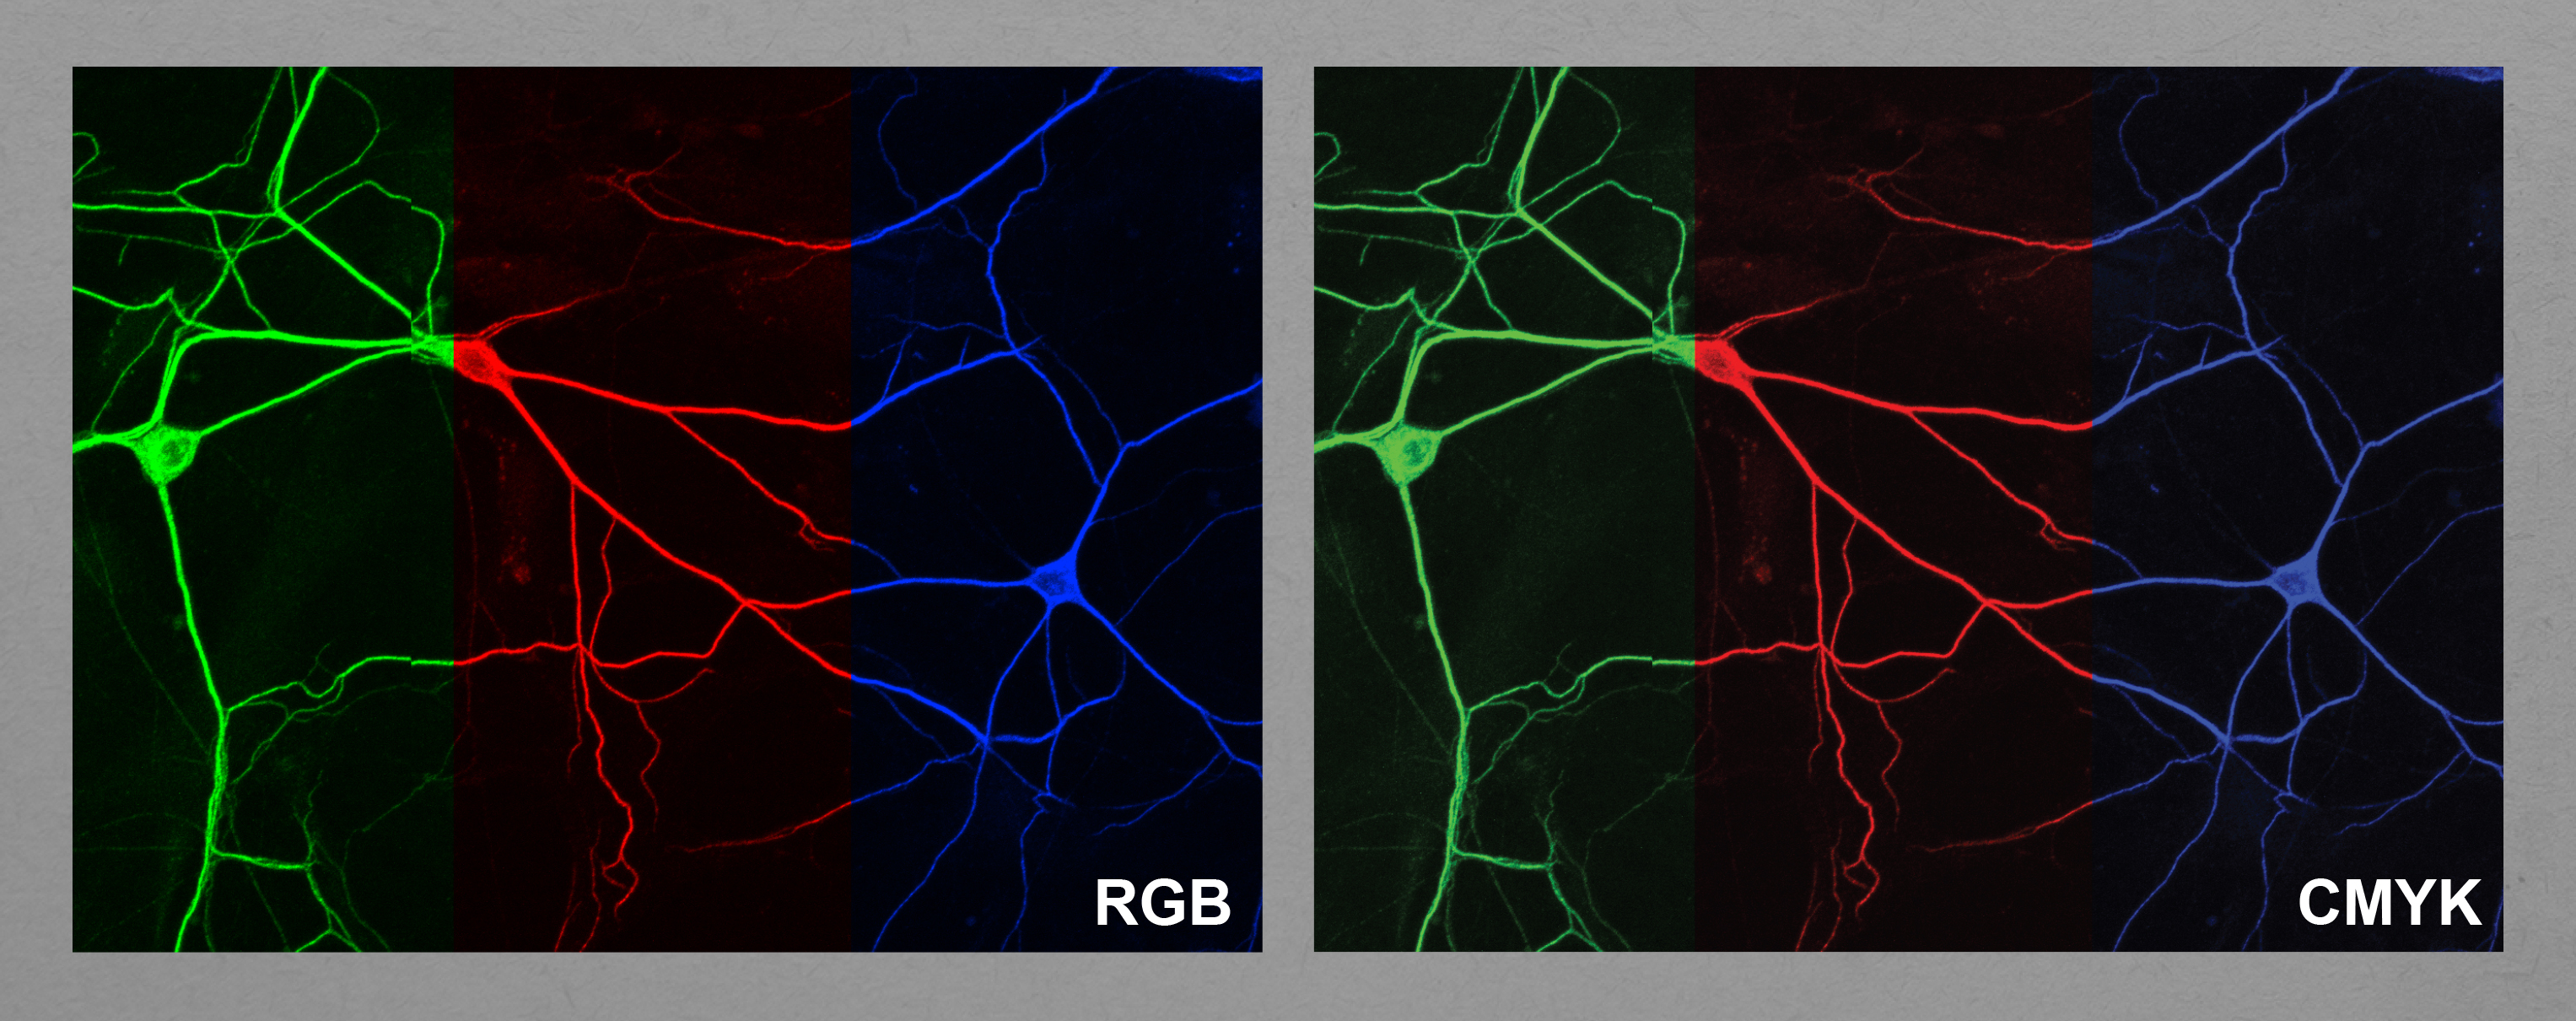
Switching an image from RGB color mode to CMYK color mode will typically reduce the vibrancy of the color, but images must be converted to CMYK if they are to be printed. You can alter the image color in CMYK after conversion to try to recapitulate some of the vibrancy, but you will be limited to printable colors. (Dr. Anne Martin)
CMYK is a subtractive system used in printing. CMYK stands for Cyan, Magenta, Yellow and Key (Black) which are typically the four ink colors which you will find in printers. Here, the more colors you add together, the darker the resulting color. CMYK cannot replicate the range of colors in RGB, and so when you convert from RGB to CMYK you will most likely notice a “deadening” or reduction of the vibrancy of the colors. And in most design programs, once you convert to CMYK, just changing the color mode back to RGB won’t bring that vibrancy back.
Note: As most journals are now read online, more and more journals are asking for submissions in RGB rather than CMYK. Be sure to check what your journal requires. And save a version in RGB to preserve vibrancy in case it is needed later.
Wrap Up That’s all for this blog post, but for more helpful graphic design tips, tune in to the #ECRWednesday webinar on January 30th. During the webinar, I will explain the different elements of design and how to use them to create an efficient visual system that clearly communicates your story.
Dr. Anne Martin is a post-doc in the Miller Lab, University of Oregon, USA. She received her Bachelor’s Degree in graphic design from the University of Georgia in 2007 and worked as a professional graphic designer for several years before returning to school to obtain her PhD in Neurobiology and Anatomy from the University of Utah. Her work can be found at www.hungrybraindesign.com and you can reach her on Twitter @thehungrybrain